Second Quarter of 2025
“Far more money has been lost by investors preparing for corrections or trying to anticipate corrections than has been lost in corrections...

Dear Clients,
We have a couple of things to cover before we begin our year-end update. Firstly, we are now two months into our new partnership with Brasada and thus far things have gone better than we could have imagined. Clients that have had the chance to meet with our new Brasada colleagues have had nothing but good things to say and some are already benefiting from Brasada’s added expertise on the fixed-income side of things. For anyone that hasn’t had an opportunity yet, we are happy to schedule a time for introductions.
Secondly, we know the holidays are a busy time, so we wanted to say thanks to all of you who have already completed your paperwork for the merger. As of year-end, we are happy to say that most of our clients have now been re-papered to Brasada – a task we thought would take well into the new year. As always, we are grateful for your continued trust and partnership. For anyone that hasn’t had time to review the documents yet, we are here to answer any questions you may have.
Thirdly, this will be the last quarterly letter you will receive from solely the GCI side of things. Going forward, you will receive quarterly updates from Brasada which will include thoughts from the GCI team. For those of you who already completed your Brasada paperwork, you will also be receiving Brasada’s Q4 letter in addition to this one.
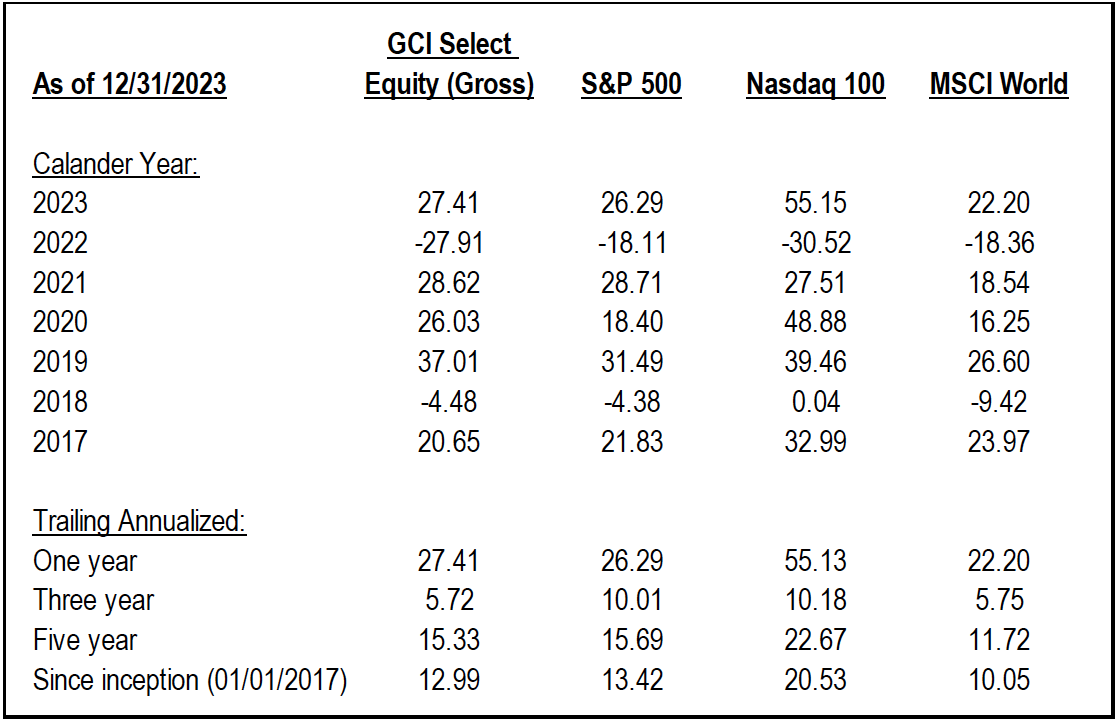
With that all out of the way, on to the markets. After a volatile start to the year, equity markets ended the fourth quarter and full year 2023 up significantly. Against this backdrop, our GCI Select Equity strategy produced very attractive absolute returns while also outperforming the broader market.
 Individual account performance may differ based on asset mix, fees, and timing of investments.
For context, when looking at the S&P 500, the return this year has largely been driven by just seven mega-cap technology stocks (Alphabet, Apple, Amazon, Microsoft, Meta Platforms, Nvidia, and Tesla). These seven names now make up roughly 30% of the S&P 500 as of year-end and were collectively up 70%+ for the year (Nvidia, Meta, and Tesla were all up 100%+). The other 493 stocks did not fare nearly as well – an equal-weighted index would have only been up roughly 14%.
The most frequent question we get is: what will the market do next year? We think that the past few years have been a great example of why we avoid this kind of short-term forecasting. Coming into 2023, the consensus view on Wall Street was that we were about to experience a recession, stocks would fall, and bonds would rise. Instead, almost the complete opposite happened. If we zoom out further to three years ago, we were experiencing a global pandemic, followed by a war breaking out in eastern Europe, followed by a banking crisis, followed by a war breaking out in the middle east. At each step, any investor that threw in the towel thinking they could time the market would have been worse off.
Rather, GCI was founded on the principle that investing in high-quality companies at attractive prices is the most durable and consistent way to achieve long-run, risk-adjusted returns. Since we standardized our model and began tracking performance in 2017, we have achieved roughly a 13% annualized gross return. More importantly, we believe we have achieved these results while taking on significantly less fundamental risk than the overall market, which is now concentrated in a handful of technology names.
The reason we can be confident of this is because we know what we own (something most investment advisers are unable to claim). We do the deep fundamental work to build a portfolio where we can confidently say that no matter what is happening with global pandemics, or wars, or who the next president may be, our portfolio companies will continue producing attractive cash-based returns regardless. We truly believe it is better to own a few names that we know inside and out than it is to own 500 names that we know nothing about.
Consider our two largest equity positions: GFL Environmental (GFL) and Crown Castle (CCI). Both companies operate in simple but critically important industries. GFL operates in the waste management industry ensuring that our day-to-day waste is picked up and disposed of. CCI operates cellular towers which are the infrastructure backbone that allows for our ever-increasing mobile data consumption.
We are confident that both businesses will remain profitable decades into the future. We can’t say the same is true for some of the larger names in the S&P 500 – whether it is Nvidia which faces a customer base that has been actively trying (and admittedly failing) to reduce their dependence on them or Tesla which is currently valued at more than every other car company combined.
Both might be tremendously successful in the coming years; we just don’t think they are as safe a bet as some of what we own. Like Warren Buffett says, “we would rather be certain of a good result than hopeful of a great one.”
In our continued effort to help you understand what it is we own and why, we have included a write-up at the end of this letter discussing our most recent addition to the portfolio, Union Pacific Corp (UNP). As always, please feel free to reach out to us if you would like to discuss anything in this letter in further detail or if you would like to schedule a time for a meeting.
Kind regards,
Guy Davis, CFA
David Shahrestani, CFA
Union Pacific Corporation (UNP): A Perpetual Tollbooth on Economic Activity
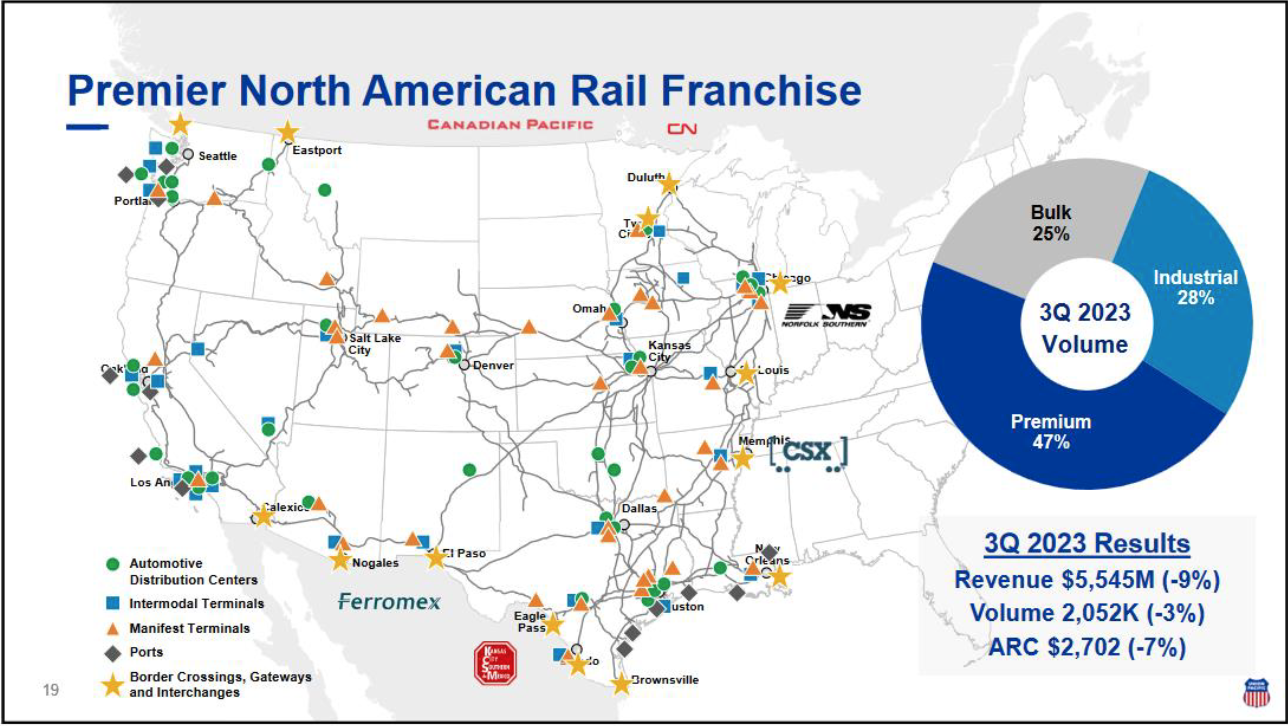
We have recently purchased shares in Union Pacific Corporation (UNP) for our GCI Select Equity model. UNP is a Class 1 Railroad that has what we believe to be the best network in the industry which primarily operates longer routes west of the Mississippi with strategic access to Mexico:

Long-term clients will recall that we have owned the Railroads in the past as we find them uniquely attractive businesses – the industry is made up of regional duopolies, with considerable barriers to entry in the form of capital requirements, regulation, and network effects which have been built up over 200-years of consolidation. In addition to this substantial moat, Railroads provide freight transportation services which are often the cheapest, if not only, method for transporting heavy freight over long distances of land allowing for considerable pricing power – 4% average price increases over the past 15 years for UNP, well ahead of inflation.
To get a sense of just how protected this industry is from competition consider that most of the modern railroad industry was built up centuries ago when our country was still an undeveloped frontier without any of the modern-day zoning, environmental, or other red-tape frictions that prevent new development today. Any would be competitor to the Class 1 Railroads would not only have to overcome these bureaucracies but would then also need to invest such an astronomical amount in replicating these assets that there would be almost no chance of adequate returns.
We cannot think of another industry, except maybe waste management, where we are as confident that the industry will still be around and flourishing not just decades from now, but centuries from now.
In the past, the investment case for the Railroads has largely revolved around pricing-based growth and expanding margins. To make a long-story short, Railroads weren’t the best run industry for the majority of their 200-year existence. This changed first with deregulation in the 1980s, but then more so when a gentleman named Hunter Harrison came along in 1990s and began to implement what he called Precision Scheduled Railroading (PSR) at one railroad after another (UNP only began adopting PSR in the past 5 years).
Before PSR, Railroads optimized around building the longest trains possible – meaning that a train would not depart a station until it was fully loaded. Think of this like if airlines waited for every possible passenger to be boarded before taking off, canceling a flight altogether if not enough passengers showed up – you would no longer know what time your departure was, nor when your arrival would be, and worse, as a plane was delayed in one location, there would be a domino effect throughout the entire network.
After PSR, the focus shifted from moving the longest trains possible through the network, to moving the most railcars through the network. The way this worked was that railcars no longer waited for trains to reach a certain length to be moved. Instead, trains would constantly be in motion with precisely scheduled departure times for railcars to be added or removed. By focusing on railcar movement, this led to less idle inventory in yards, which in turn meant the need for less yards, less trains, and ultimately less labor – along with the steadily improving margins that come with that. Consider that in 2022, the operating margin at UNP was 40%, up from just 21% 15 years ago.
However, the reason we are excited today is that not only should we continue to benefit from pricing and margin expansion going forward, but volumes are finally inflecting upward as well. One reason for this is that a major headwind to volumes, coal freight, has reduced in mix over the years, meaning that a continued drop in coal volumes will affect UNP’s economics less so than in the past. Consider that in 2022, Coal volumes made up just 10% of UNP’s business, down from 20% a decade ago.
On top of that, we believe non-coal freight volumes should manage above average growth over the next decade due to two key factors: 1) continued share gains from trucking and 2) a secular move towards near-shoring with more economic activity taking place domestically.
Rail currently accounts for somewhere between 10-15% of overall freight transportation revenue in the US with trucking making up most of the rest. As we mentioned before, Rail transportation is not only cheaper over longer distances than trucking, but also significantly more environmentally friendly both due to a lower carbon footprint, but also due to reduced congestion on highways that are already in disrepair. As PSR leads to more consistent Rail service, and as fuel costs, regulations, and labor shortages disadvantage the trucking industry, we can see UNP’s share of freight increasing.
Then consider recent geopolitical events – whether it was the global pandemic in 2020 or Russian invasion of Ukraine in 2022, both disrupted supply chains and exposed the need for onshoring strategic industries while also increasing our investment in infrastructure back home, both of which will drive volumes for UNP for years to come. For example, when our domestic economy imports a car from abroad, the
Railroads may transport that car from a port to a dealership resulting in a single revenue event. But as we nearshore more of that supply chain, we are not only transporting the finished product, but we are moving the raw materials to make the parts, the parts to the assembly factories, and many other revenue generating steps along the way.
In summary, we should expect a combination of volume growth, pricing growth, and margin expansion going forward.
Why Union Pacific?
UNP is an example of a great business that has been poorly managed over the past few years as evidenced by their service issues. This mismanagement has created an opportunity for us now that UNP has received a big upgrade in leadership. Jim Vena, the new CEO of UNP as of August 2023, has over 40 years of experience in the industry having also worked under Hunter Harrison at Canadian National Railroad implementing PSR.
We believe that Mr. Vena will be able to turn around UNP in the near-term, leading to materially higher margins, which when paired with volumes finally inflecting up should result in one of the best growth profiles in the industry. We are comfortable underwriting 2% volume growth, 4% pricing growth, and 2% margin expansion, which with a 3% buyback and 2% dividend should get us to roughly a 13% total shareholder return.
Considering the quality here, we find UNP very attractive in today’s market.
This quarterly update is being furnished by Brasada Capital Management, LP (“Brasada”) on a confidential basis and is intended solely for the use of the person to whom it is provided. It may not be modified, reproduced or redistributed in whole or in part without the prior written consent of Brasada. This document does not constitute an offer, solicitation or recommendation to sell or an offer to buy any securities, investment products or investment advisory services or to participate in any trading strategy.
The net performance results are stated net of all management fees and expenses and are estimated and unaudited. These returns reflect the reinvestment of any dividends and interest and include returns on any uninvested cash. In addition to management fees, the managed accounts will also bear its share of expenses and fees charged by underlying investments. The fees deducted herein represent the highest fee incurred by any managed account during the relevant period. Past performance is no guarantee of future results. Certain market and economic events having a positive impact on performance may not repeat themselves. The actual performance results experienced by an investor may vary significantly from the results shown or contemplated for a number of reasons, including, without limitation, changes in economic and market conditions.
References to indices or benchmarks are for informational and general comparative purposes only. There are significant differences between such indices and the investment program of the managed accounts. The managed accounts do not necessarily invest in all or any significant portion of the securities, industries or strategies represented by such indices and performance calculation may not be entirely comparable. Indices are unmanaged and have no fees or expenses. An investment cannot be made directly in an index and such index may reinvest dividends and income. References to indices do not suggest that the managed accounts will, or is likely to achieve returns, volatility or other results similar to such indices. Accordingly, comparing results shown to those of an index or
benchmark are subject to inherent limitations and may be of limited use.
Certain information contained herein constitutes forward looking statements and projections that are based on the current beliefs and assumptions of Brasada and on information currently available that Brasada believes to be reasonable. However, such statements necessarily involve risks, uncertainties and assumptions, and prospective investors may not put undue reliance on any of these statements. Due to various risks and uncertainties, actual events or results or the actual performance of any entity or transaction may differ materially from those reflected or contemplated in such forward-looking statements. The information contained herein is believed to be reliable but no representation, warranty or undertaking, expressed or implied, is given to the accuracy or completeness of such information by Brasada.

“Far more money has been lost by investors preparing for corrections or trying to anticipate corrections than has been lost in corrections...
.png)
UNDERSTANDING TARIFFS: ECONOMIC IMPACT, RATIONALE AND CONTROVERSIES
%20(3).png)
Market Selloff Dear Clients and Friends, Thursday and Friday marked the 4th time in the last 50 years when the S&P 500 had a 2-day drop of over...